In this article, we are going to learn how to implement beautiful charts in Flutter. Charts are a great visual way to represent any type of data, be it statistical data, financial data, or stats. We are using charts in a lot of our Flutter app templates, and we are going to describe how we implemented them.
When it comes to data visualization or representation in any field, the first thing that comes to our mind is charts. Charts are an effective and efficient mechanism to display statistical data that will not only make it easier to read the data but also compare and contrast. It helps display data in an informative way that makes it easy for readers to comprehend the overall data.
Now that we know the importance of charts in the statistical world, we should also know that charts are very useful to display complex data in mobile applications as well. Here, we are going to learn how to add charts to a Flutter mobile app.
The Flutter mobile application development framework is booming in the current context and it will surely take the center stage as a state-of-the-art mobile app development tech in near future. In this tutorial, we are going to make use of a charts_flutter package to add different charts to our Flutter app UI. The idea is to install the library and use the different charts widget offered by it. We will also learn how to define the series list value that is to be used by chart widgets to visually represent the data.
So, let’s get started!
Setting Up the Flutter Charts Project
First, we need to create a new Flutter project. For that, make sure that the Flutter SDK and other flutter app development-related requirements are properly installed. If everything is properly set up, then in order to create a project, we can simply run the following command in the desired local directory:
flutter create chartpost
After the project has been set up, we can navigate inside the project directory and execute the following command in the terminal to run the project in either an available emulator or an actual device:
flutter run
Creating a Home Page UI
Now, we are going to create a home page Scaffold. For that, we need to create a file called home_page.dart. Inside the file, we can use the code from the following code snippet:
import 'package:flutter/material.dart';
import 'package:charts_flutter/flutter.dart' as charts;
class HomePage extends StatelessWidget {
  @override
    return Scaffold(
      appBar: AppBar(
        backgroundColor: Colors.red,
        title: Text("Bitcoin price from Jan to March (2021) "),
      ),
      body: Center(
        child: Text("Hello, Charts!")
        ),
    );
  }
}
Here, we have returned a simple Scaffold widget with an App Bar and a body from the stateless widget class called HomePage.
Now, we need to import this stateless widget class in our main.dart file and assign it to the home option of the MaterialApp widget as shown in the code snippet below:
import 'package:chartpost/home.dart';
import 'package:flutter/material.dart';

void main() => runApp(MyApp());

class MyApp extends StatelessWidget {
  @override
  Widget build(BuildContext context) {
    return MaterialApp(
      debugShowCheckedModeBanner: false,
      home: HomePage(),
    );
  }
}
Now if we re-run the app, we will get the following result in our emulator screen:
Adding the charts_flutter Plugin
Since we are going to add charts to our app, we are going to use the package called charts_flutter. This package is a Material Design data visualization library written natively in Dart. It provides a wide range of charts for data visualization which is lightweight and easy to configure as well. Now in order to install this library into our flutter project, we need to add the charts_flutter: ^0.8.1 line to our pubspec.yaml file as directed in the code snippet below:
dependencies:
  flutter:
    sdk: flutter

  charts_flutter: ^0.8.1
After successful installation, we are ready to use the chart widgets offered by this package.
Bar Charts in Flutter
In this section we are going to learn how to add a bar chart to our Flutter app. Firstly, we are going to create a model file that defines attributes of the data to be shown in the bar chart. Here, we are going to name the file bitcoin_price_series.dart. Inside, we are going to define a class called BitcoinPriceSeries that takes in three parameters - month, price, and color. The overall code implementation is shown in the code snippet below:
import 'package:charts_flutter/flutter.dart' as charts;
import 'package:flutter/foundation.dart';

class BitcoinPriceSeries {
  final String month;
  final int price;
  final charts.Color barColor;

  BitcoinPriceSeries(
      {@required this.month,
      @required this.price,
      @required this.barColor});
}
Now, we need to create a new file called bitcoin_price_chart.dart to define the chart structure. Here, we are going to implement a stateless widget called BitcoinPriceChart that returns the Bar chart with series value. The Series configuration offered by charts library helps us define each series of data. The exact implementation of how to configure the series value is provided in the code snippet below
import 'package:charts_flutter/flutter.dart' as charts;
import 'package:chartpost/bitcoin_price_series.dart';
import 'package:flutter/material.dart';

class BitcoinPriceChart extends StatelessWidget {
  final List<BitcoinPriceSeries> data;

  BitcoinPriceChart({@required this.data});

  @override
  Widget build(BuildContext context) {
    List<charts.Series<BitcoinPriceSeries, String>> series = [
      charts.Series(
          id: "Price",
          data: data,
          domainFn: (BitcoinPriceSeries series, _) => series.month,
          measureFn: (BitcoinPriceSeries series, _) => series.price,
          colorFn: (BitcoinPriceSeries series, _) => series.barColor)
    ];
Now that we have the list data that holds the bar chart series data, we can apply it to the UI template. Now, we are going to return a Container widget with Card widget as child that holds the BarChart widget taking the list and animate boolean value as parameters. The overall implementation is provided in the code snippet below:
return Container(
      height: 400,
      padding: EdgeInsets.all(20),
      child: Card(
        child: Padding(
          padding: const EdgeInsets.all(8.0),
          child: Column(
            children: <Widget>[
              Text(
                "Bitcoin price from Jan to March (2021) ",
              ),
              Expanded(
                child:( charts.BarChart(series, animate: true)),

              )
            ],
          ),
        ),
      ),
    );
  }
}
Now, we are going to add the Bar chart to our home page. For that, we need to import the BitcoinPriceChart stateless class widget into the home_page.dart file as shown in the code snippet below:
import 'package:flutter/material.dart';
import 'package:chartpost/bitcoin_price_series.dart';
import 'package:chartpost/bitcoin_price_chart.dart';
import 'package:charts_flutter/flutter.dart' as charts;
After import, we can define the list that stores the data based on BitcoinPriceSeries model as shown in the code snippet below:
@override
  Widget build(BuildContext context) {
     final List<BitcoinPriceSeries> data = [
    BitcoinPriceSeries(
      month: "Jan",
      price: 50000,
      barColor: charts.ColorUtil.fromDartColor(Colors.red),
    ),
    BitcoinPriceSeries(
      month: "Feb",
      price: 60000,
      barColor: charts.ColorUtil.fromDartColor(Colors.blue),
    ),
    BitcoinPriceSeries(
      month: "March",
      price: 58000,
      barColor: charts.ColorUtil.fromDartColor(Colors.green),
    ),
  ];
Lastly, we need to add the BitcoinPriceChart widget to the body of the Scaffold in home page bypassing the required list data as shown in the code snippet below:
return Scaffold(
      appBar: AppBar(
        backgroundColor: Colors.red,
        title: Text("Bitcoin price from Jan to March (2021) "),
      ),
      body: Center(
        child: BitcoinPriceChart(
      data: data,
    )
        ),
    );
  }
Hence, we will get the bar chart on our home screen as demonstrated in the emulator screenshot below:
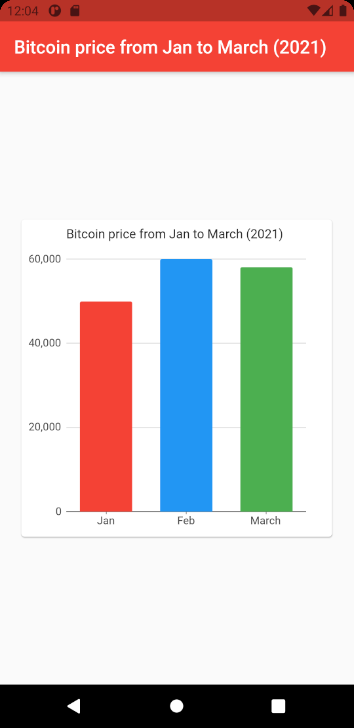
Hence, we have successfully added a bar chart to our Flutter app.
Pie Charts in Flutter
Now that we know how to configure the data for the bar chart, we can easily add a pie chart as well using the exact same series list data. The bar chart data series and pie chart data series share the same format of data. Hence, we can simply add a pie chart using the PieChart widget offered by charts library supplying series list and animate boolean parameters as shown in the code snippet below:
Expanded(
  child:( charts.BarChart(series, animate: true)),
 ), Expanded(
    child:( charts.PieChart(series, animate: true)),
 )
Note that, this PieChart widget was directly added to the bitcoin_price_chart.dart file just below the BarChart widget inside the Column widget.
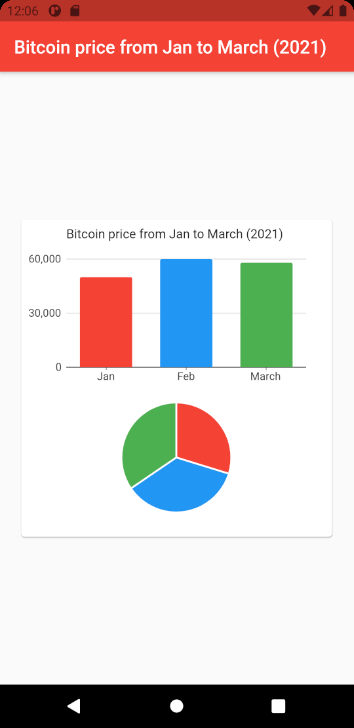
Hence, we have successfully added a Pie chart to our Flutter app as well.
Conclusion
The main goal of this tutorial was to demonstrate how to implement various charts in Flutter. The availability of the charts_flutter library made it easier to add charts to our Flutter app. The series-based data configuration along with lightweight widgets for a wide variety of widgets makes this library very powerful and efficient as well. Here, we learned how to add a bar chart and a pie chart. We also learned how to configure the series-based data to feed to chart widgets.


